

November Journal Entry 2

Hey everyone,
I hope your weekend’s well! Back to pen some thoughts.
I’ve been trying to piece together the learnings I’ve gathered from 2 persons I’ve been following: Darius (@42macroDDale) and Jake (@Trendspider_J). I’m mainly invested in the US stock market, here’s why.
Darius provides an excellent pulse of the market now and probabilities of future conditions through his backtested models.
Jake is excellent at charts and price action.
So, Q4.
Based on Darius’s data-backed projections, I gather that two of the highest probability market regimes to the end of 2021 would be Reflation and Inflation/Stagflation (I wrote about market regimes previously here). All this depends on the rate of change of economic growth and inflation.
Here’s a quick recap:
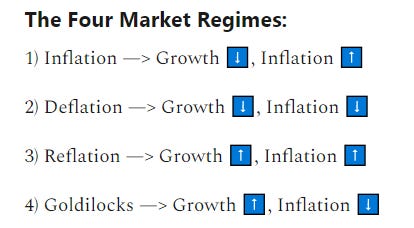
Inflationary pressures don’t seem to be cooling at the moment, thus, if growth doesn’t rebound from its negative rate of change, we will likely see the inflation market regime. If growth does improve showing a positive rate of change, we could very well see the reflation market regime. That’s how it stands pending more economic data.
Goldilocks and Deflation market regimes will come into the picture only if inflation starts to show a negative rate of change.
Based on Darius’s playbook, these are the best and worst-performing sectors to allocate capital to in each of the 4 market regimes:

Focusing on Reflation and Inflation market regime, let’s see what the charts say.
If Reflation market regime regime,
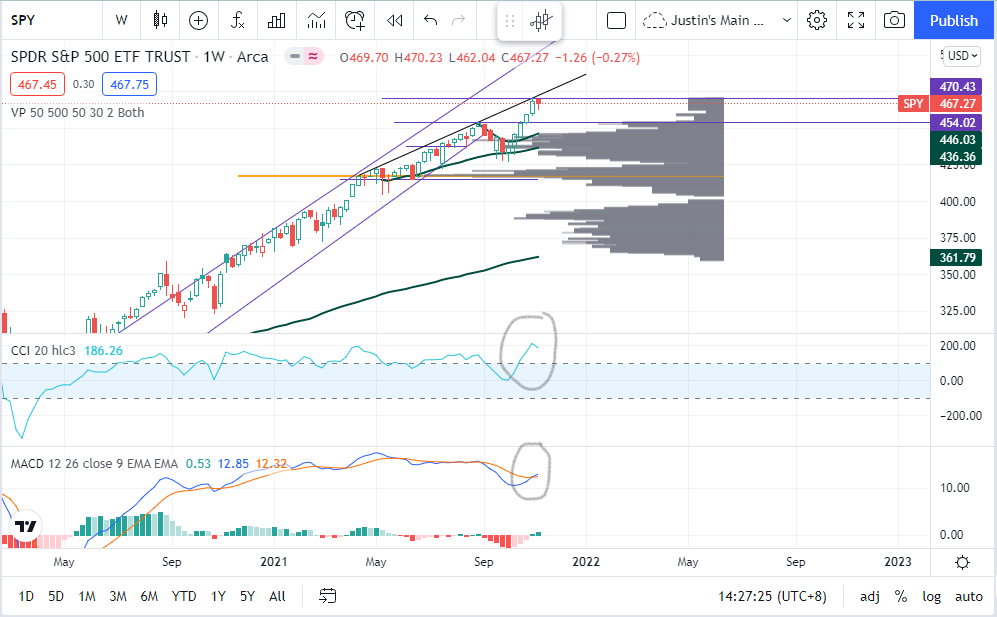
Let’s take a look at the SPY chart - the etf tracking the S&P 500. I chose this as I believe it captures the top 5 equity sectors that will perform well and more importantly mega cap growth stocks.
On the weekly charts:
On the daily charts:

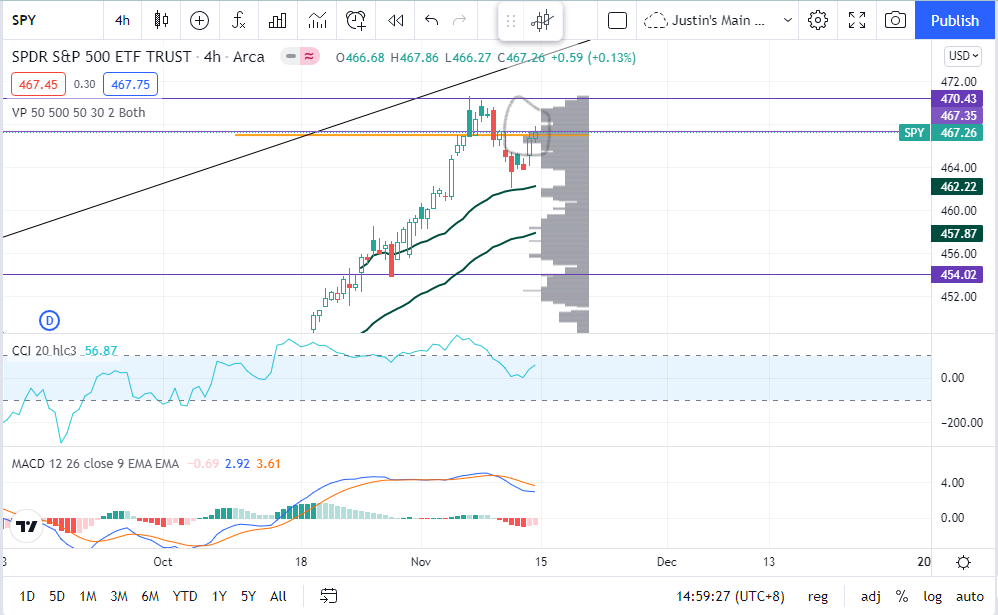
On the 4 hour charts:
Based on these charts, here’s my thoughts (not financial advice):
Longer term (> 1 month )
Risk to reward will improve if we break above that sloping trend line that has acted as resistance since May 2021. A strong catalyst for that is improvement in economic data month over month and quarter over quarter. Unless you’re actively trading, wait for a breakout above the resistance line pending improved economic data confirming reflation market regime.
Shorter term ( day to weekly trades):
Looking at the daily and 4-hour charts, the SPY looks to retest the sloping resistance line. If it opens and holds above 467.35 (the top of the volume profile), we could run to 470 and beyond that a new all time high in the mid 470s.
If inflation takes over as the primary market regime,
Inflation or this current situation we’re in - stagflation ( slowing growth with increasing inflation) is usually a risk-off environment. Risk-off usually means a market correction in the stock market.
One place money goes when it’s not in the stock market is into government bonds, ‘the less risky asset’.
On the weekly charts:

On the daily charts:

On the 4-hour daily charts:

If inflation should gain ground and take over as the primary market regime,
The TLT could break $151 if stagflation does play out, the weekly chart set up is there for it to move higher. However in the very short-term, we could still see a slightly lower move in its price to 145-146 based on the daily and 4-hour charts. Below that we could see 140.
TL;DR: There isn’t a clear direction in the markets lately. This will be solved soon as more economic data coming out.
If you’re not into trading and have a long-term horizon, I wrote a piece here on dollar cost averaging into the SPY.
Till next time, stay healthy and safe!
For resources that I personally use, click here.