

January Journal Entry

Hey Everyone,
Happy new year! Here’s wishing you nothing but the best 2022!
If it hasn’t started well, there’s always hope as long as you stay in the game!
Intro
Anyway, on the stock market side of things, it definitely hasn’t been all nice and rosy. It’s been volatile indeed.
There’s no clear-cut market regime (Goldilocks, Reflation, Inflation, Deflation) right now. (I wrote about the 4 different market regimes here).
Based on Darius’s analysis and projections, the market seems to be in a reflation market regime in the short-term right now (as of 8th January 2022) with the later part of 2022 projected to be deflationary pending confirmation.
As always, I give you the gist of this journal entry first, you’re most welcomed stay on to read it in full
TL;DR:
When in doubt, zoom out. I’ve updated the dollar cost averaging strategy back test tracking the SPY (S&P 500) for the new year as well as created a new back test sheet for QQQ (NASDAQ 100) → Click here to view
Summary of back tests below:
By dollar cost averaging buying stocks
SPY portfolio today = US$ 87,420.93, Returns 173% on invested capital, Average yearly returns 11%
QQQ portfolio today = US$ 89,172.96, Returns 272% on invested capital, Average yearly returns 27%
By buying long-term call options yearly (Click here for how to do it)
SPY portfolio today = US$ 940,248, Returns 2838% on invested capital, Average yearly returns 177%
QQQ portfolio today = US$ 2,932,145, Returns 12117% on invested capital, Average yearly returns 1212%
If you’re in it for the long-term, it’s hard to lose (reminder to myself as well). I initially wrote about why it’s hard to lose here.
Details
As you know, I initially did the back test on the SPY only as it has the longest history and tracks a basket of the top 500 stocks across various sectors in the US.
However, I’ve begin to wondered how would the QQQ which tracks predominantly large cap technology growth stocks would perform using the same strategies.
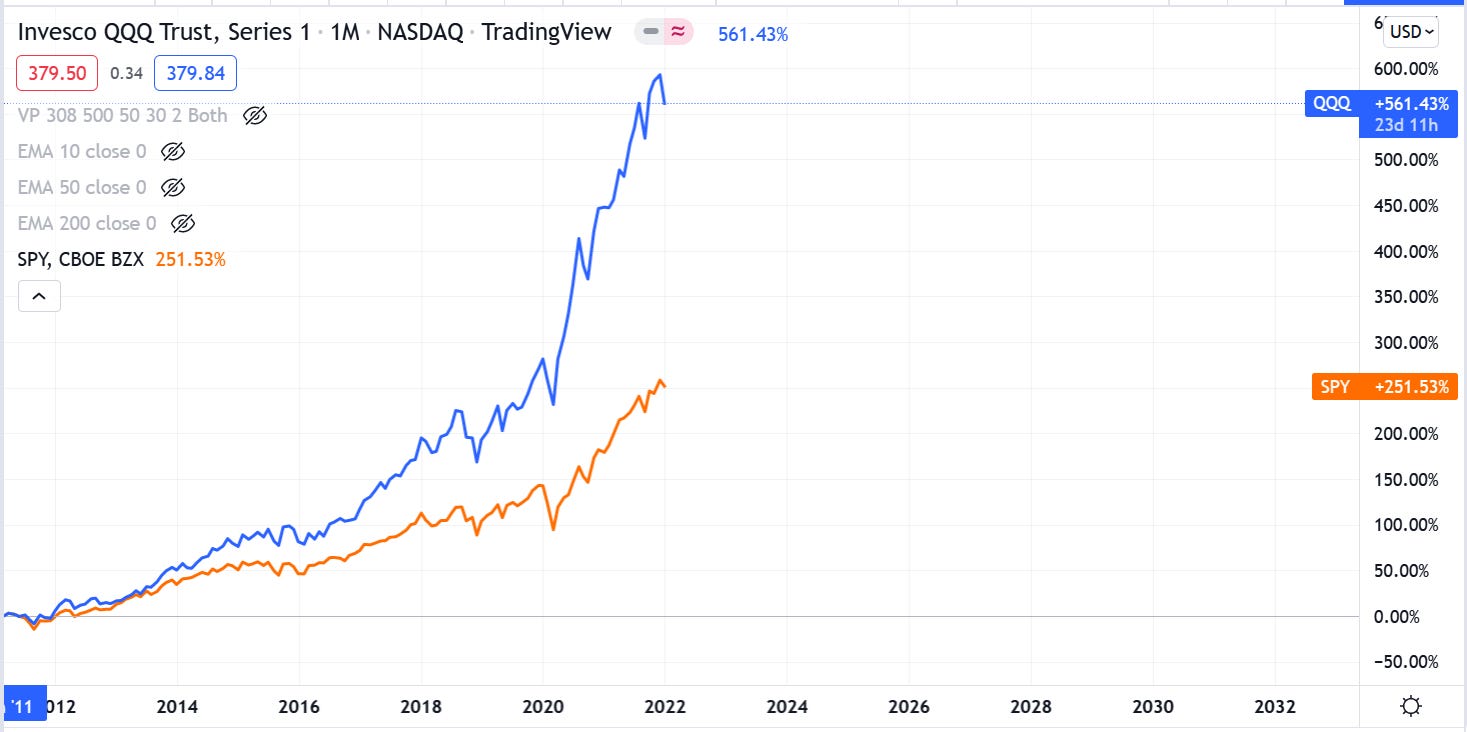
I use tradingview.com to see charts, if you’re looking for a good website, try them.
As you see, since the financial crisis of 2008-2009, technology has massively outperformed in a low and decreasing interest rate environment led by the FAANG stocks.

^Interest rates since 1980s

^ Total US Public Debt since 1980s
With the US debt to GDP ratio increasing dramatically since 2008, it is hard (but not impossible) to see interest rates go back up without running into debt financing/repayment issues. This coupled with the US Federal Reserve (FED)’s tendency of stepping in to stop the US stock markets from crashing dramatically, it is an ideal environment for technology growth stocks in the long-term. We may suffer short & sharp market corrections but over the long-term it has shown to go up.
Just my opinion from what I’ve gathered.
Would love to back test ARKK ETF in the future as well following this little thesis.
And so, you’ve seen the results of the portfolios with just US$2,000 invested annually at the start of each year. That equates to about US$170/month or US$6/day set aside to invest.
Simply dollar cost averaging annually you’d have built a portfolio of close to US$90,000 with an invested capital of US$24,000 (QQQ since 2011) and US$32,000 (SPY since 2007)
Harnessing the power of options, it gets better, you’d have been a millionaire coming out of the last decade with just US$24,000 (QQQ since 2011) and US$32,000 (SPY since 2007) invested overall.
Once again, the back tests were inspired by Sean Seah in this video.
If options are something scary for you, fret not, you can always learn. And as I did, I learnt from Sean here. Here’s the link to if you’re keen to learn too!
Hope this gives perspective and helps you!
Take care,
Justin